Understanding crash and exception reports
Crash and exception reporting captures problem data and displays it in the Cloud Diagnostics Crashes and Exceptions section of the Unity Services Dashboard. The types of problems crash and exception reporting captures are:
- Native crashes - A native crash report captures the stack trace and other metadata when your app stops responding. In most cases, this is due to a failure in the native layer of the application.
- Unhandled exceptions - A managed exception report captures the stack trace and other metadata when your app stops responding due to an unhandled exception in the managed layer of the application.
Crash and exception reporting aggregates the individual reports of an issue into a Problem Report.
Crash and exception reporting provides the CrashReportHandler class to configure the crash reports and work with custom metadata.
Use the SetUserMetadata method to add up to 64 custom metadata entries to your report.
To view your crash and exception reports, you can open the Unity Developer dashboard from either the Cloud Diagnostics panel in the Unity Editor or you can sign in to the Unity Developer Dashboard.
To access your crash and exception reports from the Editor:
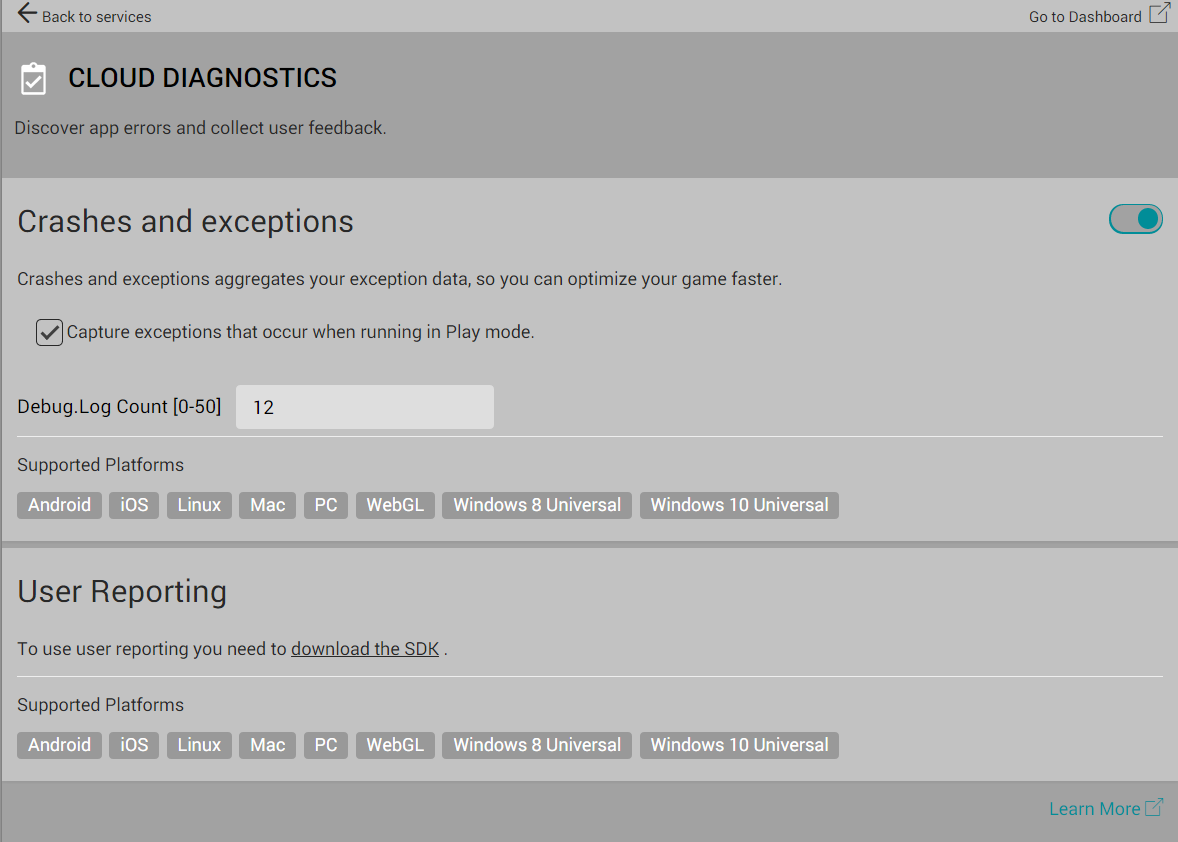
- On the menu bar, select Window > General, then select Services.
- In the Services window, select Cloud Diagnostics.
- On the Cloud Diagnostics panel, click Go to Dashboard:

- In the left navigation bar, select Cloud Diagnostics, Then click Crashes & Exceptions.
To access the Services Dashboard from a browser:
- Sign in to the Unity Developer Dashboard.
- Choose the Cloud Diagnostics service
- Open the Project that has the exceptions to view.
- In the left navigation bar, select Crashes and Exceptions.
Exceptions that occur when you are testing a game or app in the Editor are flagged in the console using a red exclamation icon.
The crash and exception reporting window
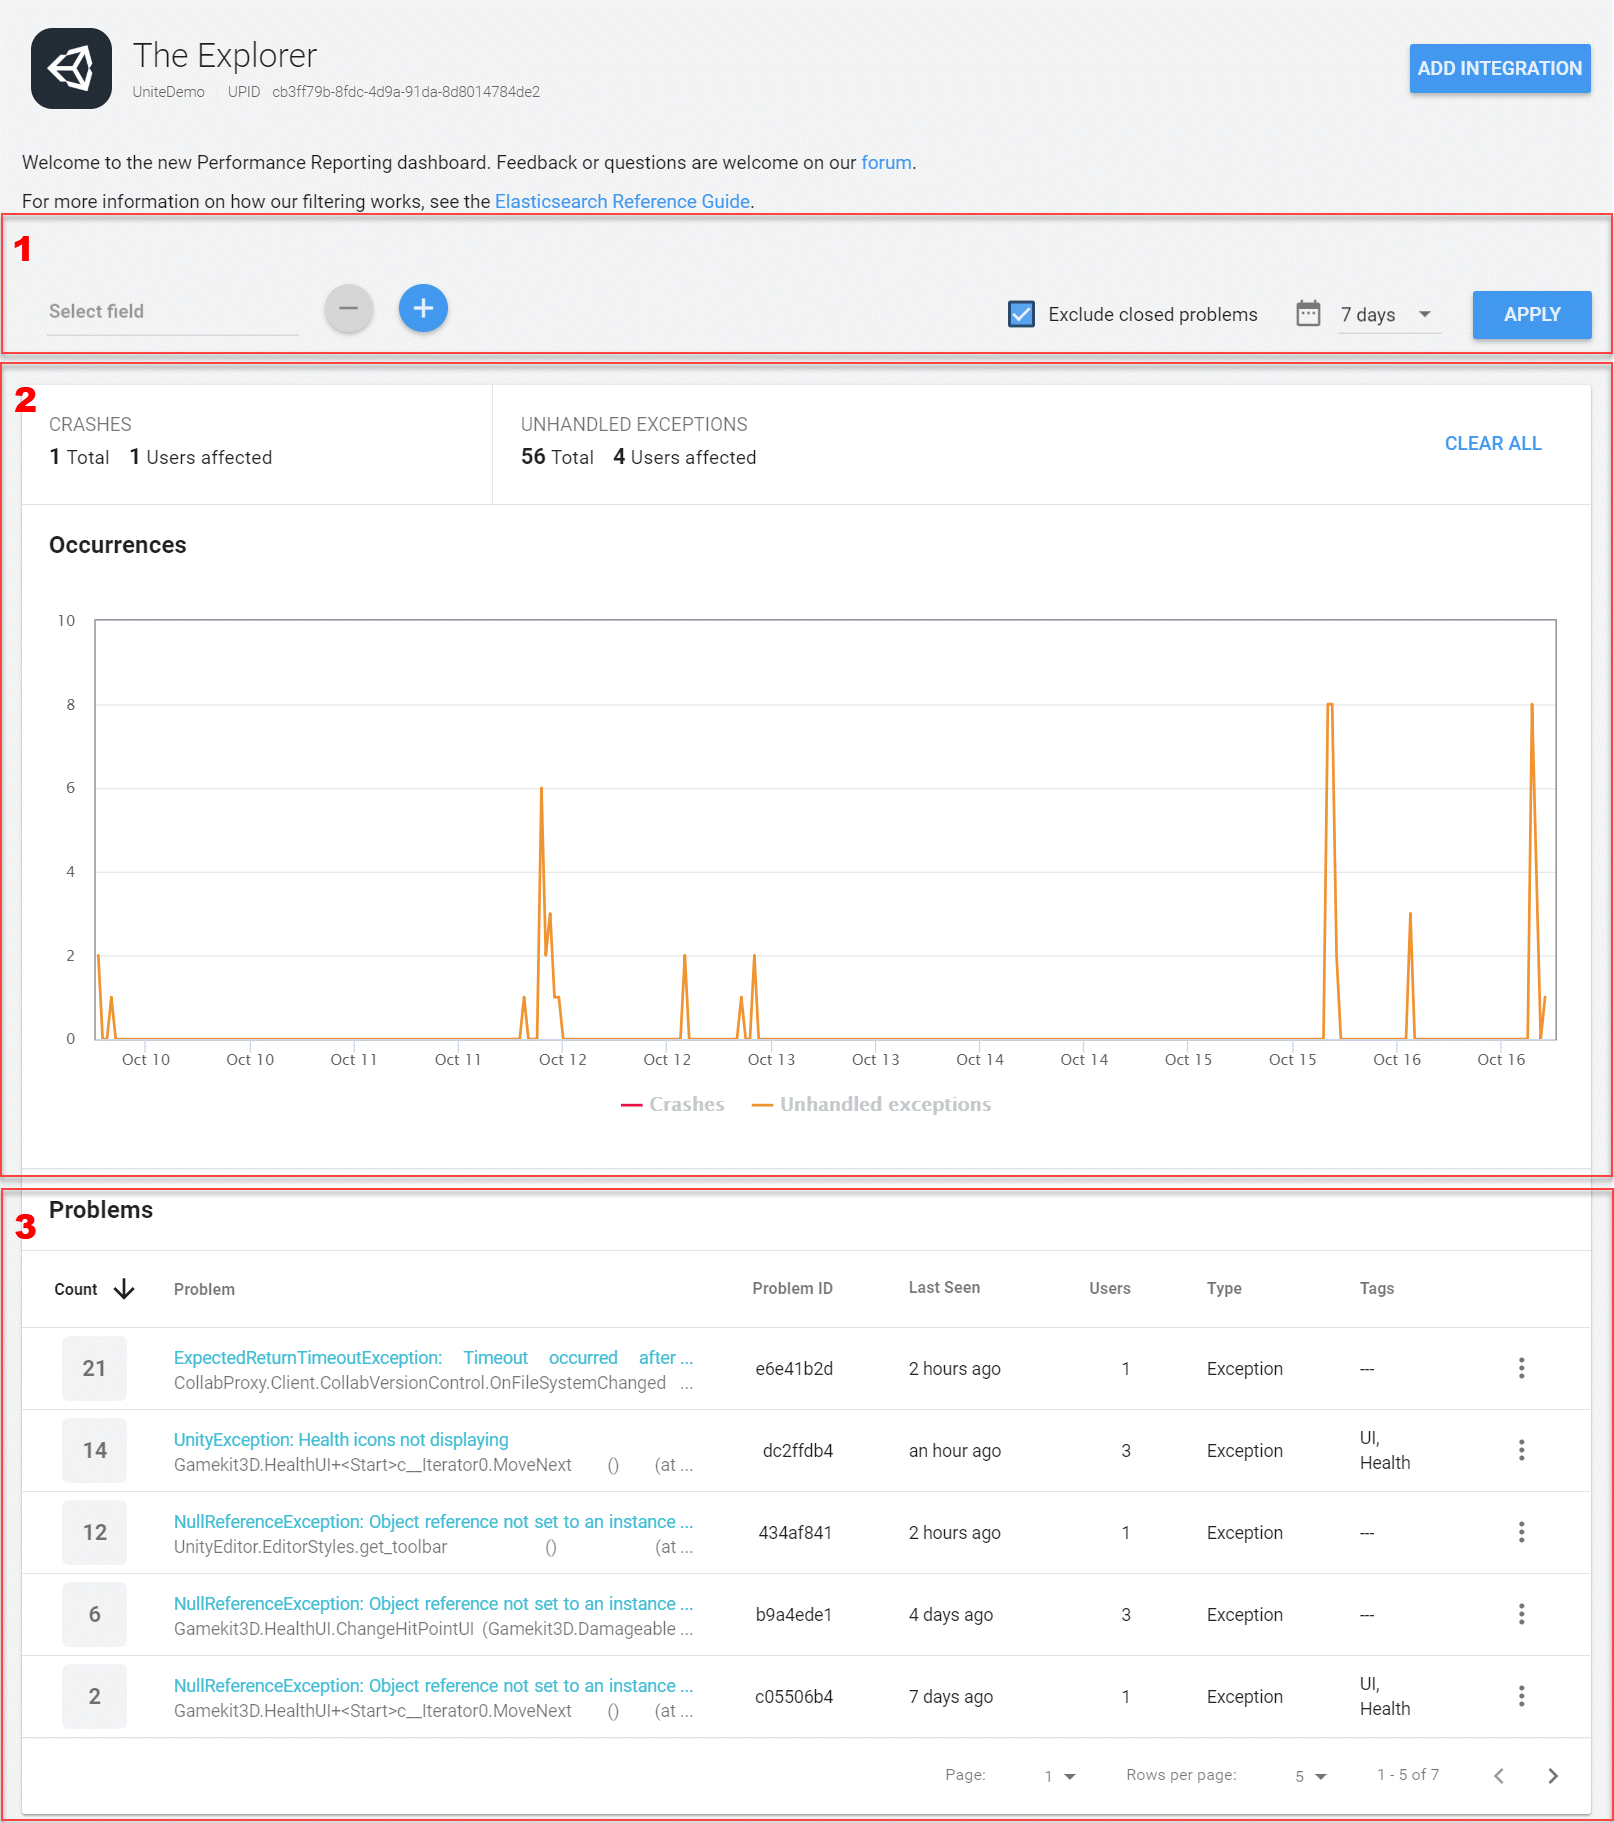
The crash and exception reporting window consists of three parts:
- Filters
- Overview
- Problems list

Filters
You can filter your reports to focus on specific types of issues. The results of the filters you select are displayed in the Overview and the Problems list.
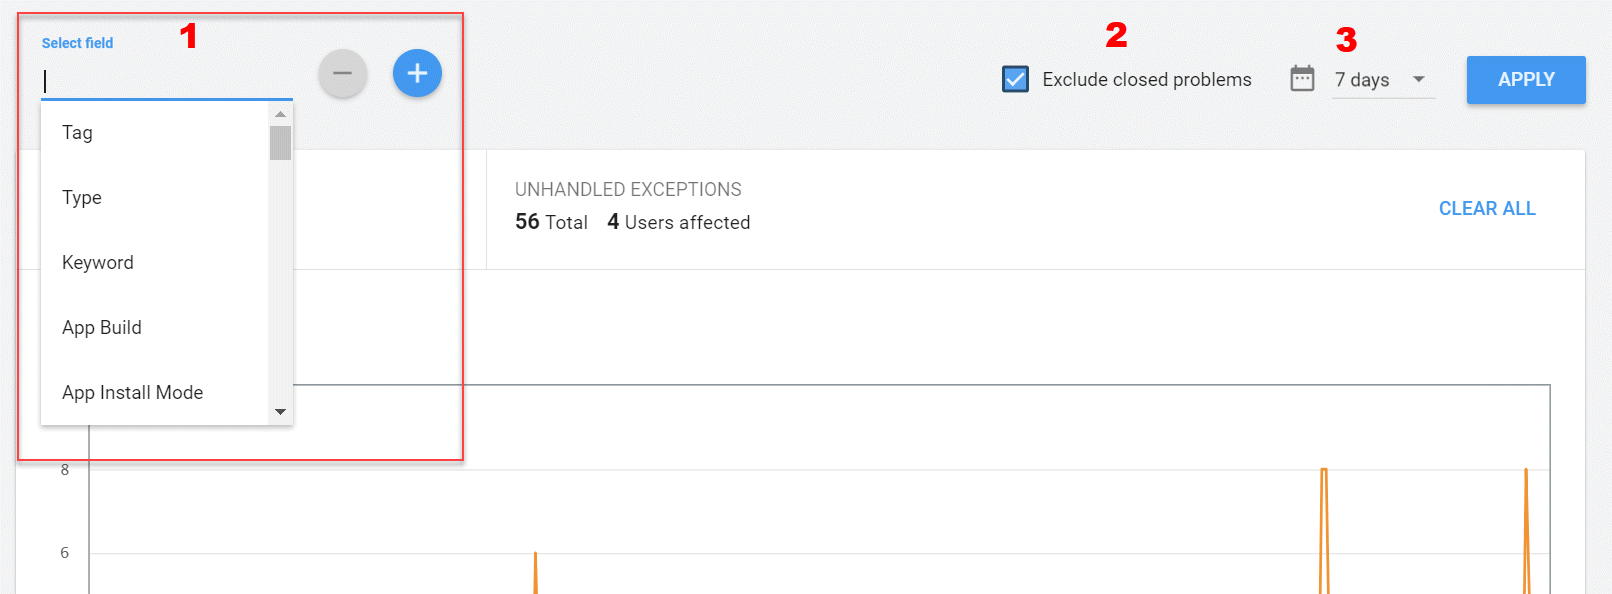
Filtering options:
- Field, which includes Tag, Type, Keyword search, or a subset of the metadata fields.
- Problem status, to include or exclude closed problems.
- Period of time over a set number of days.

The Select Field drop-down menu allows you to choose from a set of preselected items that includes meta-data in the report. You can define a maximum of 13 field filters.
To apply a field filter:
- Click the Select Field drop-down.
- Select the item to filter on.If the item requires a value, a second drop-down opens. Select the value to apply.
- Click the APPLY button.
To add filter fields, click the (+) button. To remove the most recently added filter field, click minus (-) button.
To filter on only open problems, enable the Exclude closed problems checkbox and then click the APPLY button. This filters any problems tagged as "Closed" and is selected by default.
You can filter on predefined periods of time, from 24 hours to 90 days. To specify the date range, click the report period drop-down and select the period to display. Then, click the APPLY button.
Problems list
The Problems list displays the following information:
- The top section of the page displays aggregate data on the total number of crashes, unhandled exceptions, or both, and the number of users affected by each.
- A graph of the number of Problem Reports over the selected period of time.
- A list of Problem Reports sorted by total number of reports of a given type. By default, the list is sorted in descending order.
To remove all existing data, click Clear All. This deletes all reports that occurred up until that moment. If an open problem arises after you remove the current data, Unity adds it to the the Problems list and summary.
Problem details
To view the details of a specific Problem Report, click on the report to expand the view:

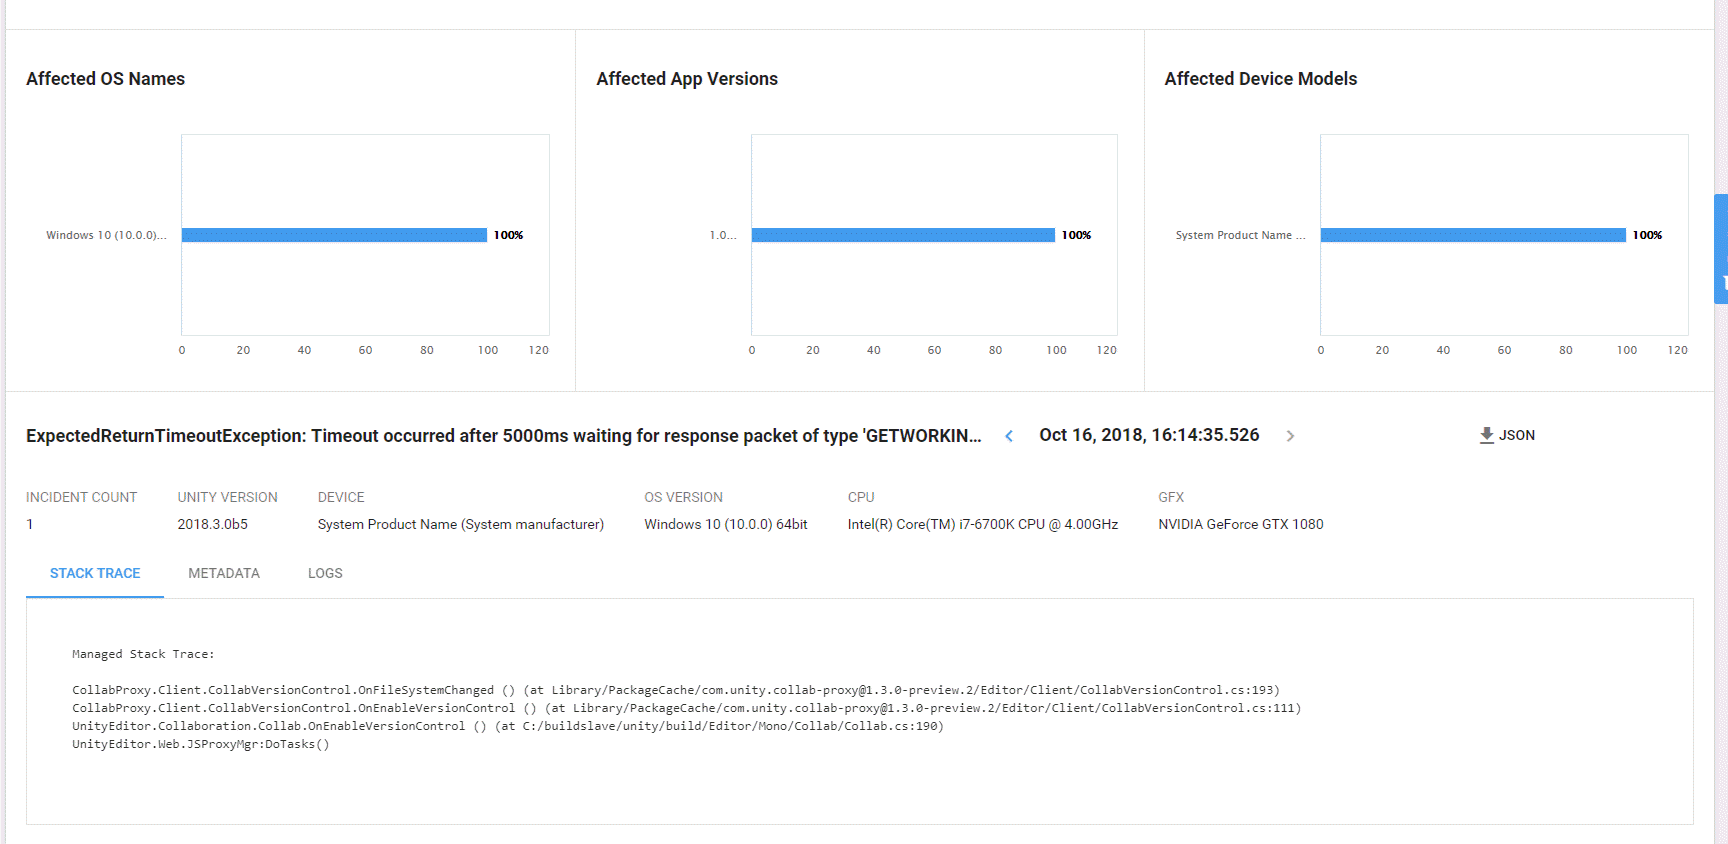
The top section of the Problem Report displays aggregate data in a graphical view of the occurances of the problem over time and affected percentages of the top five operating systems, app versions, and device models.
The bottom section displays individual problem reports consisting of the title of the Problem Report and the date and time the currently viewed crash or exception report occured. Use the left < and right > arrows to scroll through other reports of the problem.
Tabs
The tabs at the bottom of the expanded problem display contain:
- Stack trace - Contains the stack trace (managed, unmanaged, or both) for the specific report of the problem that you are viewing. A stack trace can help you determine the location in your code at which the problem occured.
- Metadata - Contains device-specific metadata for the device on which the problem occured. This is also where you can view custom metadata that you define in your code. To set custom metadata use the CrashReportHandler.SetUserMetadata method.
- Logs - Contains log messages that you output using the Log methods in the Debug class. Log messages include the type of message, the date and time, the occurrence frame, and the message. The default number of log messages captured is 10. You can configure this to capture 0 to 50 messages using the CrashReportHandler.logBufferSize method.
You can download the data for a specific report of the problem in JSON format. To download the report, click the JSON link in the top right corner of the expanded problem display.